Data & Tech Services (D&TS): A Primer
May 10, 2025

May 10, 2025
By Luis Fernando Lopes and Nazir Tarraf
DEFINITIONS AND BRIEF HISTORY
For the purposes of this investigation, data & tech services are all the procedures or devices needed to create, process, store, secure and exchange information. Under this definition, D&TS has been developing along with humankind for millennia, the oldest records being tally sticks, petroglyphs (rock carvings) and petrographs (rock paintings), which date back to 18,000 - 20,000 years before the Common Era (BCE). The invention of numbers (3,000 - 4,000 BCE) and instruments for arithmetic calculations such as the abacus (circa 2,400 BCE) were breakthroughs, and so were the alphabet (circa 1,700 BCE) and books (hand-written scrolls in 500 BCE) in later eras.
As for modern data analytics and storage, one key milestone was John Graunt’s first recorded experiment in statistical analysis in London in 1662, when he recorded detailed information about mortality and theorized on an early warning system for the bubonic plague. Another landmark was the creation of a tabulating machine by Herman Hollerith in the United States to process the vast amount of data produced by the 1880 census. In 1928 Fritz Pfleumer pioneered the magnetic tape recording in Germany, still the same technology used today to store computer data, as well as audio and video signals. A few years later, in 1943, the first electronic digital programmable computer performed Boolean and counting operations in the United Kingdom to analyze large volumes of information, thus helping decipher Nazi codes during World War II. Yet, despite breathtaking technological advances, only in 1996 digital data storage became more cost-effective than storing information on paper.
RUNNING THROUGH KEY NUMBERS
To be sure, the ultra-fast development of data & tech services is one of the defining features of the Information Age and the Network Society, respectively defined as the latest stage of capitalism in which economic value creation relies heavily on information technology, and the dominant social structure that emerges with it.[1] To illustrate that, it suffices to say that the world’s population has grown 1.5 times since 1990 while the number of mobile voice subscriptions multiplied by 646 over this time, so much so that the estimated number of users in 2023 and living inhabitants are now similar: 7.2 billion versus 8.1 billion, respectively (Chart I). However, humankind is growing at decreasing rates, is expected to stabilize at around 10 billion people by 2084 and then decrease, according to the most recent forecast of the United Nations Population Division. Nothing of this sort is likely to happen in the realm of D&TS, though.
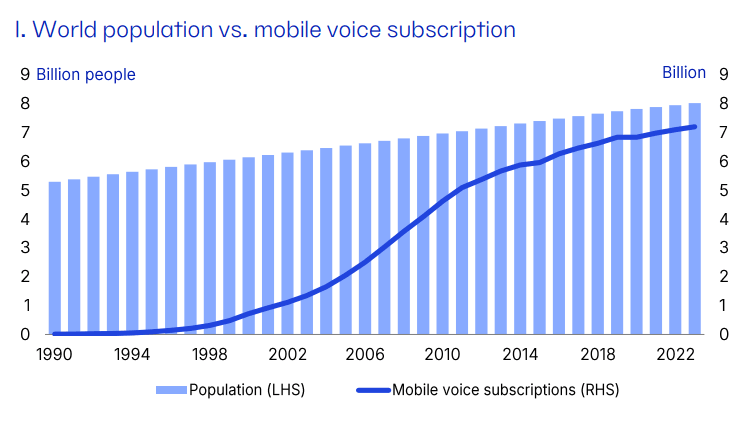
646x Growth of mobile voice subscriptions since 1990
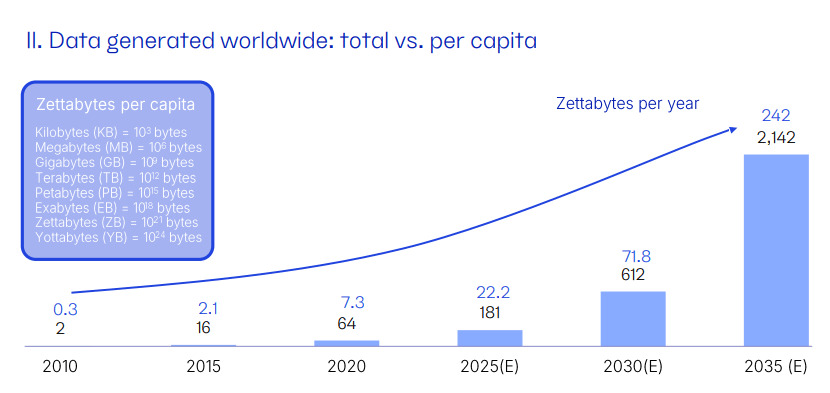
On the contrary, the amount of data created per capita is increasing at an exponential rate, which more than compensates for the slower population growth. To fully appreciate this phenomenon, it is instructive to get some fundamental concepts right. In digital storage, the basic measurement unit is the byte, which contains eight bits, or a series of eight zeros and ones. Moving to the realm of massive quantities, one zettabyte (ZB) is defined as 1021 bytes. A 400-page book with 50 characters per line and 50 lines per page takes a million (106) bytes, or one megabyte (MB), therefore one ZB is equivalent of 1015 (ten quadrillion) such books. In 2010 an estimated two ZB of digital information was created in the world, which, divided by nearly seven billion inhabitants who were living at that time, resulted in 0.3 ZB per capita. In 2023 the respective numbers were 120 ZB and eight billion people, thus resulting in 15 ZB per capita and a compound annual growth rate (CAGR) of 36%. By 2035, the respective estimates are 2,142 ZB and almost nine billion people, hence a projected 242 ZB per individual (Chart II)[2]
Why so much global data production? Certainly, it is a multi-factor process that combines rapidly growing number of people using multiple products that are evolving technologically at a fast rate (Chart III). To list but a few, the items available to the typical non-business consumer today are mobile or smart phones, laptops or desktop computers, tablets, smart watches or wristbands, games’ consoles, streaming services (to access movies, TV programs, music, and so forth), and virtual reality devices. Streaming services, for instance, have particularly voracious appetite for digital storage: downloading a single two-hour HD-quality film may demand up to 14 gigabytes (GB), that is, 109 bytes. Unsurprisingly, video is responsible for over half (54%) of all global data traffic. To compare, an estimated 333 billion emails are sent every day and still they account for only 5% of the worldwide information flow.[3]
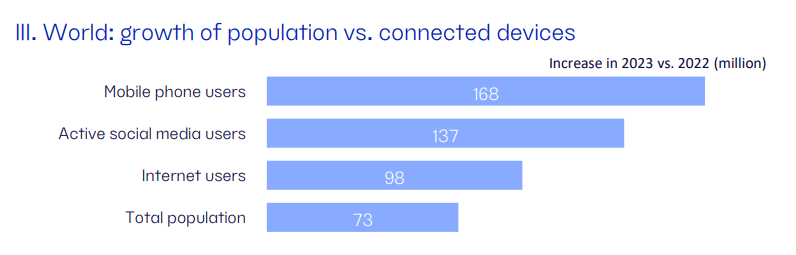
168 MM Mobile phone users increase in 2023 vs. 2022
Admittedly, valuing businesses in data & tech services is an arduous task because companies’ valuations can vary wildly across the economic cycle and even in the very short-term. Against this backdrop, a reliable proxy for effective market demand is the global spending with information and communication technology. In this context, the industry was valued at US $28 trillion in 2023, 27% of global GDP, and its CAGR since 1990 is 5.2%, adjusted for inflation (Chart IV). To compare, the CAGR of the world’s real GDP during the same period is considerably lower: 2.9%. More importantly, value creation in data & tech services has become far less volatile in recent years and the last time its real rate of growth went below zero was in the early 2000s, in the aftermath of the dot-com crisis. D&TS, therefore, has come of age. While still a thriving area for venture capital and small firms, it is now a mainstream activity, attracting multi-billion investments not only from the private sector, but also from governments.
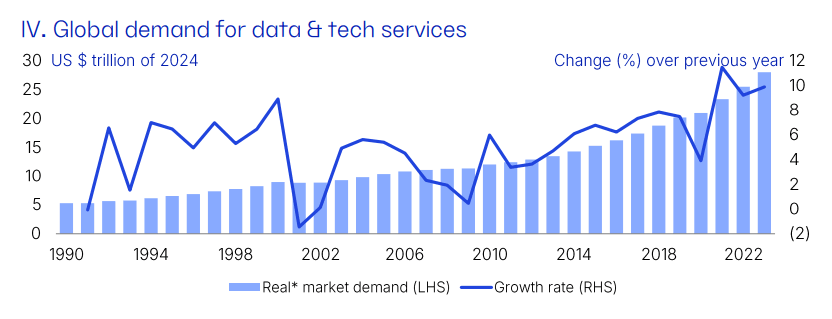
Note(*): Real means adjusted for inflation in USD.
MAJOR TRENDS IN D&TS
Because it is a booming market, there is no shortage of powerful trends in data & tech services. For easier consideration of related topics, it is instructive to group them into two major categories: inner areas of D&TS and outer realms which depend heavily on innovations from this industry. The estimated capital expenditures (CAPEX) in 2023 funded with equity amounted to US $266 billion for the first category – the key subclasses being Artificial Intelligence (AI) Revolution, Computing & Connectivity, and Digital Future - the and US $411 billion for the second, notably with Global Sustainability and Cutting-Edge Engineering. However, the total amounts invested in this industry are likely to be far higher when debt financing is included in the calculation.4
The buzzword in the inner areas of D&TS is, of course, AI and it is indeed the most exciting space at this moment. Its backbone, Generative Artificial Intelligence, that is the development of algorithms that take any sort of data as input (number-series, texts, images, sounds, and so forth) to create new content (codes, audio, images, texts, etc.), continues at full tilt. The so-called foundation modes, used to perform tasks like summarization, classification, and answering questions, are perhaps one of its most fascinating features because they are able to learn from their own outputs and improve over time. But it was Applied Artificial Intelligence that drew most of the equity funding from investors in the same period: US $89 billion, or 71% of the total allocated to the AI Revolution trend (Chart V). This is, of course, the universe of machine learning (ML) and like devices that solve classification, prediction, and control problems in order to automate activities (including ML itself), improve decision making, along with other encouraging developments.
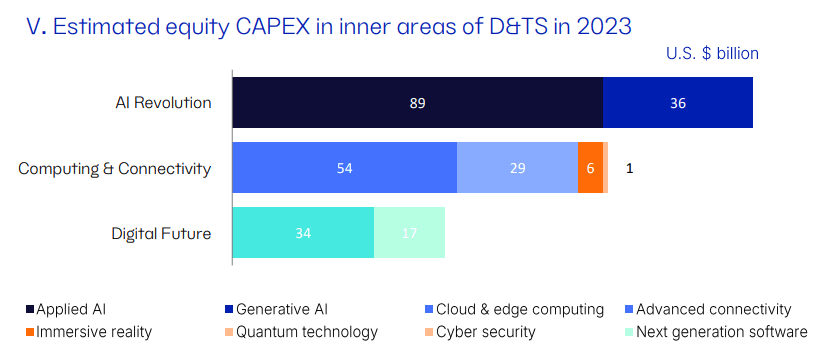
The second inner area of D&TS, closely related to the AI Revolution, is computing and connectivity, which attracted an estimated US $90 billion of equity funding in 2023. Possibly its most intriguing subgroup consists of cloud and similar paradigms. As per the definition of the International Organization for Standardization (ISO), they provide network access to a scalable pool of shareable physical or virtual resources with self-service provisioning and administration on-demand. In this context, the evolution of hyperscale remote data centers and local nodes, together with the advances in latency optimization and the reduction of data-transfer costs have been brisk. Another subset, also in this area, are wireless low-power networks, 6G cellular, Wi-Fi 6 and 7, low-Earth-orbit satellites, and other telecom technologies whose rapid progress is worth highlighting. Lastly, two subcategories deserve mention, not because there are huge CAPEX programs but because of their striking technological advances: immersive reality – real-time interactions in non-natural spaces that range from fully computer-generated virtual reality (VR) to mixed reality (MR), all the way to augmented reality (AR) – and quantum computing – the application of the laws of quantum mechanics to solve complex problems that are too difficult for the current generation of classical computers.
In the third inner area of D&TS, the building blocks of the digital future, a sign of times: the equity CAPEX required to strengthen digital identity and trust architectures, cybersecurity, and the Web3 (decentralized or semantic web) in 2023 was twice as much as that spent on next-generation software development. The latter consists of business investments in technologies that enable, among other advances, modern code deployment pipelines and automated code generation, testing, refactoring (code restructuring without changing its original functionality), and translation.
As for the outer realms of D&TS (Chart VI), the business investment required to meet technological demands of global sustainability has been robust, notably to help increase the usage of renewable energy, such as solar and wind power; or of sources that have a substantially lower carbon footprint, like nuclear and hydrogen. Sustainable fuels, bioenergy, energy storage and distribution solutions – long-duration battery systems and smart grids, for instance – are other examples of areas where digital & tech services are in high demand. And the same applies to solutions that try to mitigate the negative effects of natural resource consumption on the climate, either by removing carbon dioxide (CO2) from the atmosphere or by producing materials with lower CO2 equivalents.
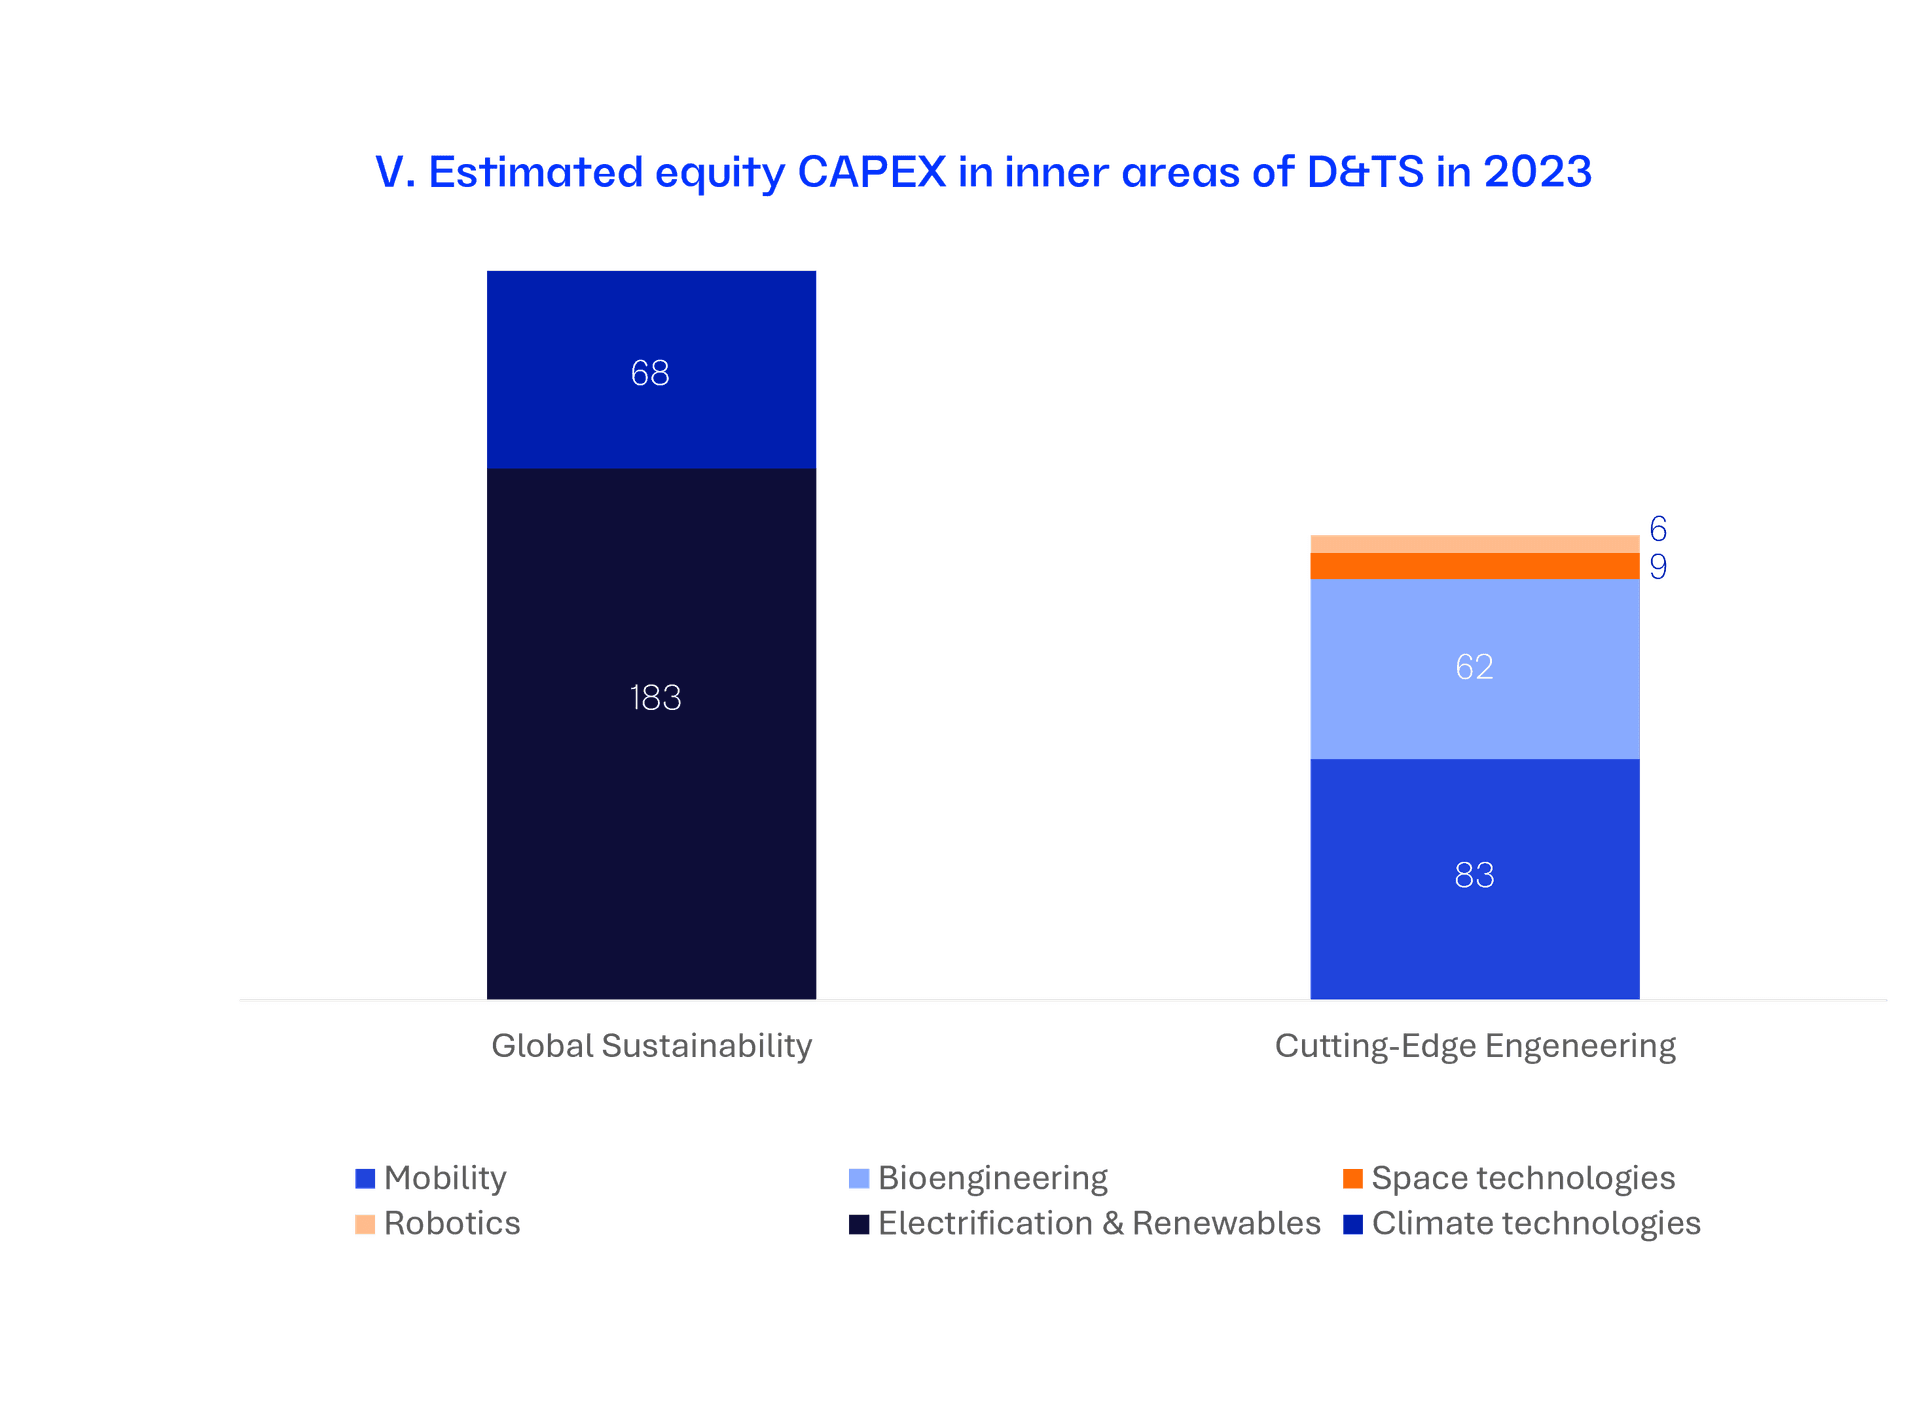
US$ 251 BN Total estimated equity CAPEX of Global Sustainability
Over the years, cutting edge engineering has always sparked excitement in the public and media conversation. Although most of the frenzy has been around risks and opportunities related futuristic developments of robotics and space technologies, the big checks are indeed being written for more down-to-earth propositions. One of them is enhanced mobility, that is, CAPEX to upgrade the efficiency and sustainability of land, water and air transportation (electric and autonomous-driving vehicles, shared-mobility strategies, and so forth). And the other one is bioengineering, especially biological and computing advancements with an emphasis on improving human health. In this case the focus of business investment is the transformation of value chains in healthcare, wellness, food & beverage, agriculture, livestock & fisheries to create economically viable products that may range from gene therapy to alternative protein-production or the use of biomaterials to print organs and new tissues, among others.
CONCEPTUAL VERSUS ACTUAL CHALLENGES
To be sure, the brave new world of D&TS has metrics that are nothing short of spectacular. For example, the computational power, measured by the performance of the largest supercomputer in any given year, has increased by a factor of seven million since 1995, whereas the cost of RAM memory is now 0.002% of what it was back then (Chart VII). Can such progress be sustained?
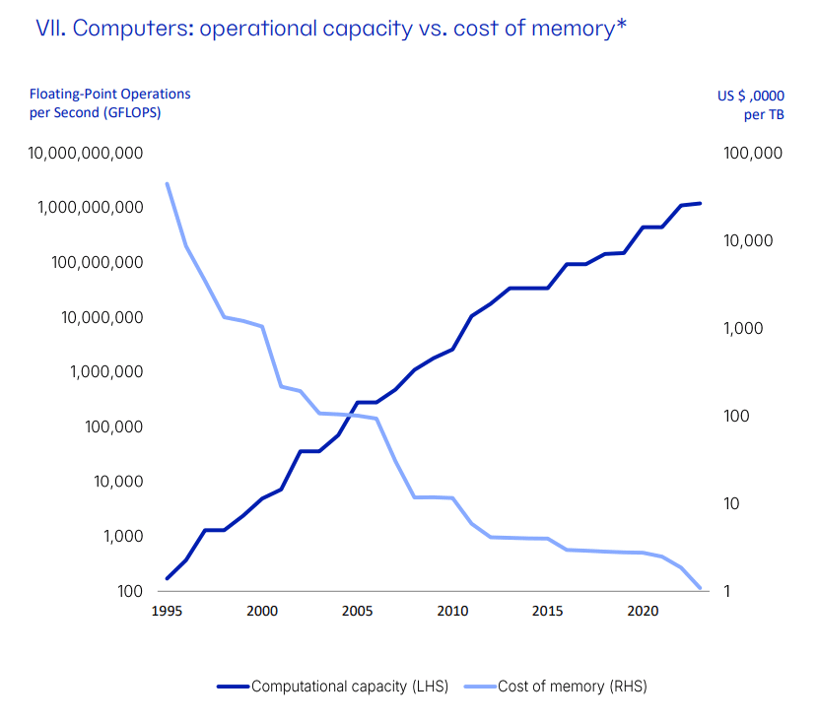
Obs (*): Logarithmic scales;cost of memory refers to market price of random-access memory (RAM).
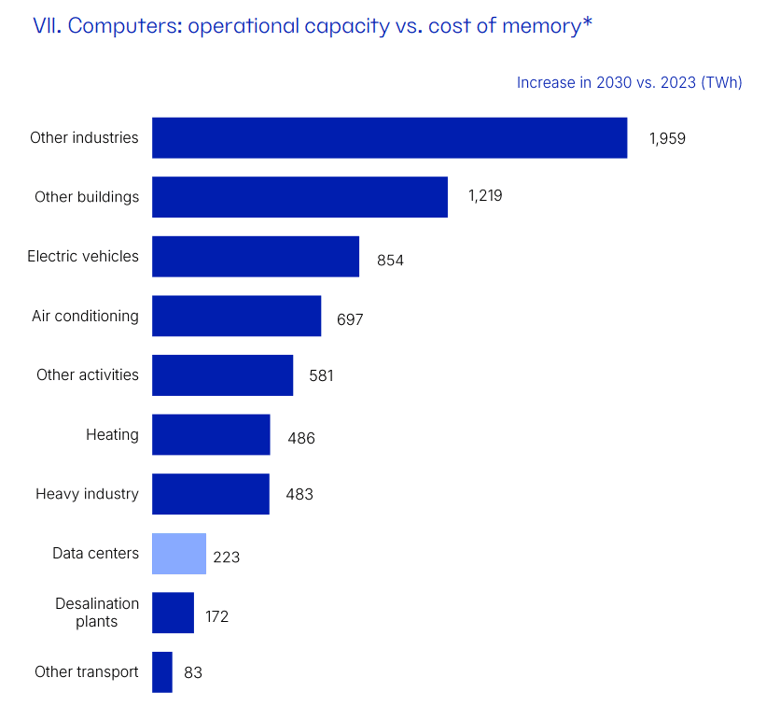
As per conventional wisdom, uncontrollable growth in energy demand will eventually check this neck-breaking technological advance, or at least slow it down. But then global data center computing, for instance, increased by more than 550% since 2010 while energy use grew only 6%. Enter the “Koomey’s Law”, which describes the dramatic increase in computations carried out per unit of energy: it doubles roughly every 18 months. Indeed, according to the International Energy Agency (IEA), the increase in electricity demand by datacenters between 2023 and 2030 is estimated at a third of what air conditioning is likely to require and a quarter of electric vehicles’ needs (Chart VIII).5 Thus human ingenuity, not environmental constraints, will continue to be the main determinant of the advances in D&TS.
As per conventional wisdom, uncontrollable growth in energy demand will eventually check this neck-breaking technological advance, or at least slow it down. But then global data center computing, for instance, increased by more than 550% since 2010 while energy use grew only 6%. Enter the “Koomey’s Law”, which describes the dramatic increase in computations carried out per unit of energy: it doubles roughly every 18 months. Indeed, according to the International Energy Agency (IEA), the increase in electricity demand by datacenters between 2023 and 2030 is estimated at a third of what air conditioning is likely to require and a quarter of electric vehicles’ needs (Chart VIII).5 Thus human ingenuity, not environmental constraints, will continue to be the main determinant of the advances in D&TS.
1 The classic reference is Castells (1997).
2 Duarte (2024).
3 Kemp (2023).
4 Adapted from McKinsey (2024).
5 Ritchie (2024).
Charts I, II, III, IV sources: United Nations, Economist Intelligence Unit, The World Bank, DataReportal, and Patria Research.
Charts V, VI, VII, VIII sources: McKinsey & Company, Our World in Data, Ritchie, and Patria Research.
BASIC REFERENCES
Castells, M. (1997) “An introduction to the information age” City - Analysis of Urban Change, Theory, Action, Vol. 2, issue 7, pp. 6-16.
Duarte, F. (2024). “Amount of Data Created Daily”. Exploding Topics. Available at https://explodingtopics.com/blog/data-generated-per-day#:~:text=According%20to%20the%20latest%20estimates,or%200.4%20zettabytes%20every%20day
Kemp, S. (2023). “Digital 2023: Global Overview Report”. Data Reportal. https://datareportal.com/reports/digital-2023-global-overview-report.
McKinsey (2024). “Technology Trends Outlook”. https://www.mckinsey.com/
capabilities/mckinsey-digital/our-insights/the-top-trends-in-tech.
Ritchie, H. (2024). “What’s the impact of artificial intelligence on energy demand?” https://www.sustainabilitybynumbers.com/p/ai-energy-demand.
DISCLAIMER - Patria Investimentos may have had, may currently hold, or may build up market positions in the securities or financial instruments mentioned in this research piece. Although information has been obtained from and is based upon sources Patria believes to be reliable, we do not guarantee its accuracy and it may be incomplete or condensed. All opinions and estimates constitute Patria 's judgment as of the date of the report and are subject to change without notice. This report is for informational purposes only and is not intended as an offer or solicitation for the purchase or sale of any financial instrument. Any decision to purchase securities or instruments mentioned in this research must consider existing public information on such asset or registered prospectus. The securities and financial instruments possibly mentioned in this report may not be suitable for all investors, who must make their own investment decisions using their own independent advisors as they believe necessary and based upon their specific financial situations and objectives.


